


 Copy to clipboard
Most manufacturing firms are actually manufacturers and distributors. Although a majority of the work performed involves manufacturing products for customers, a significant amount is also performed after products are produced and before they are shipped to the customer. In cases where the company ships manufactured products immediately upon completion, these post-manufacturing activities may be minor. But as customers demand more and more from their suppliers, post-manufacturing “costs to serve” the customer begin to grow and become important factors in measuring and managing customer profitability.
Warehousing finished goods, processing orders, picking orders and preparing them for shipment are common activities at most manufacturers. When the costs of these activities are significant, their measurement and assignment to the individual customers being served can provide a manufacturer with critical insights that enable its management to both accurately measure customer profitability and to manage customers to improve their profitability.
Consider two identical manufacturers—Alpha Corporation and Beta Corporation—each with $12 million in manufacturing costs, $3 million in post-manufacturing costs and $3 million in selling, general and administrative (SG&A) costs. Beta Corporation treats post-manufacturing costs as “overhead” and assigns them to customers as a percentage (25 percent: $3 million to $12 million) of the manufacturing cost of the products they produce. Alpha Corporation, on the other hand, segregates these costs into four activities—warehousing, order processing, order picking and order shipment—and assigns them to customers based on their demand for those four activities.
Exhibit 1 details the types of costs and activities that Alpha considers in accumulating the cost of their four customer service activities. Warehousing includes the capital cost required to finance finished goods, occupancy costs, insurance and property taxes, as well as the physical work performed by material handling and warehousing personnel and the administrative efforts of material management and accounting. Order processing costs include the administrative efforts of materials management, customer service and accounting. Order picking costs include the physical efforts of warehousing, material handling and shipping and receiving as well as the administrative work of materials management. Shipment includes the occupancy costs for the shipping area, the physical work of material handling and shipping and receiving and the administrative efforts of materials management, accounting and logistics.
Exhibit 1: Alpha Corporation’s Post-Manufacturing “Costs to Serve”

To assign these costs to customers, Alpha selects an appropriate “driver” (a factor that causes a change in the cost of an activity) to link each of these activity’s costs to specific customers and calculates a cost per unit of driver that it then uses to assign each activity’s cost to individual customers. Warehousing costs are assigned at $1.25 per inventory item sold; order costs are assigned at $20 per order processed; picking costs are assigned at $5 per line item picked and shipment costs are assigned at $30 per shipment.
Exhibit 2 compares the profitability measure of Customer One that buys $2 million in products that cost $1.2 million to manufacture using both Alpha’s and Beta’s costing methods.
Exhibit 2: Customer One’s Profitability Comparison
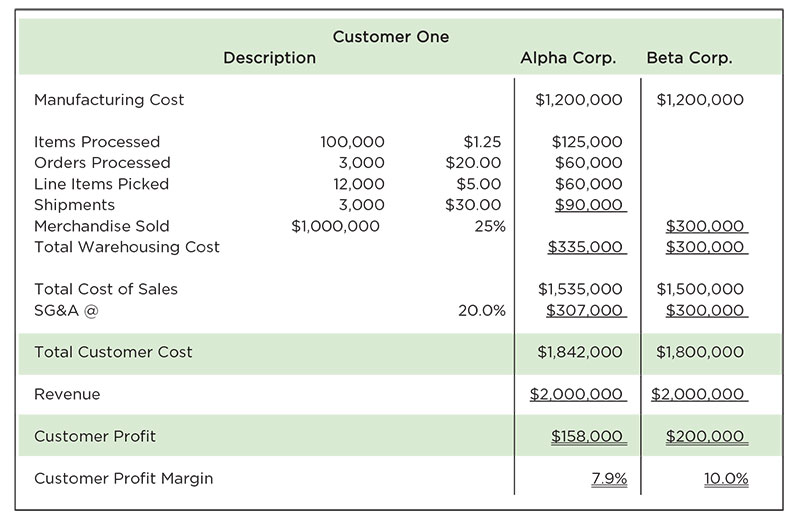
Beta Corporation simply adds 25 percent of warehousing cost to the products’ manufacturing costs to measure its cost of sales and then tacks on its 20 percent SG&A rate, to arrive at a total customer cost of $1,800,000 and a customer profit of $200,000 or 10 percent of sales. Alpha Corporation assigns costs to Customer One based upon its demand for Alpha’s four post-manufacturing services. Because Customer One’s individual orders are smaller than those of the average customer, Alpha must provide a higher than average amount of service to fulfill each dollar of Customer One’s sales. The result is a “cost to serve” that is $42,000 higher than that shown by Beta Corporation. The profit on Customer One’s business is measured at only $158,000 or 7.9 percent of sales.
Customer Two buys exactly the same volume of the same products at the same price as Customer One. Its orders, however, are larger and less frequent than those of Customer One. As a result, fewer post-manufacturing services are required to fulfill these orders and the “cost to serve” Customer Two is much less than that required to serve Customer One. As shown in Exhibit 3, Beta Corporation’s costing practices do not take into account this difference in customer service level in measuring customer profitability; it shows its profit on Customer Two’s business as being the same as on Customer One’s business. Alpha Corporation’s costing practice, however, takes this lower level of customer service into account and incorporates those lower costs when measuring Customer Two’s profitability. The lower level of service required shows that Customer Two’s profitability is $242,000 or 12.1 percent of sales.
Exhibit 3: Customer Two’s Profitability Comparison

To be effective, a company’s cost model must reflect the fundamental economics that underlie its business’ operation. A manufacturer whose products do not go directly onto an outbound truck after their final manufacturing operation has post-manufacturing activities and costs. If those costs are significant, they not only impact the measurement of customer profitability; they impact the quality of the company’s decision making and, ultimately, the company’s profitability. Two adages are in play here: “Knowledge is power” and “What gets measured gets done.”
“Knowledge is power”
For example, if Customer One requests a three percent price decrease, Beta Corporation only knows that saying “yes” will reduce its profits by $60,000 unless it can cut manufacturing costs significantly. Alpha Corporation, however, knows that Customer One is already a sub-par performer in its portfolio of business and knows what makes them a sub-par performer. They also have the measurements to know that the price reduction request provides an opportunity to actually improve the company’s profitability. They know that if they can get Customer One to agree to modify their ordering frequency to match that of Customer Two in exchange for the three percent price decrease, they could actually improve profitability, as shown in Exhibit 4. A potential reduction of $84,000 in “cost to serve” could more than offset the $60,000 price decrease, and make both the customer and Alpha more profitable.
Exhibit 4: Customer One’s Profitability after Price Decrease and Change in Ordering Practices

“What gets measured gets done”
Alpha Corporation also knows the cost of the processes required to serve the customer; Beta Corporation does not. Beta will dedicate its process improvement efforts to manufacturing activities, but because it measures them, Alpha knows it can improve profitability by reducing the cost of its four customer service activities, as well. By improving its warehousing, order process and picking and shipment processes, it can enhance its profitability by lowering its costs and being able offer more competitive prices in the marketplace.
Knowledge of process, product and customer cost is critical to the success of any manufacturer that hopes to win in a competitive marketplace. Its processes do not end, however, when the product has been manufactured; they continue until the customer’s payment has been safely deposited in the manufacturer’s bank account. A manufacturer that does not measure and manage the “costs to serve” its customers puts itself at a competitive disadvantage and leaves an opening that can be exploited by both its customers and competitors.
During more than 25 years as a consultant, Doug Hicks has championed the development of practical, down-to-earth cost management solutions for small and mid-sized organizations. In that time, he has helped nearly 200 organizations transform their history-oriented accounting data into customized, value-enhancing decision support information that provides accurate and relevant intelligence needed to thrive and grow in a competitive world. He shares his experience through seminars conducted throughout the U.S., in trade and professional periodicals and two books, including I May Be Wrong, But I Doubt It: How Accounting Information Undermines Profitability. He can be reached at .