Copy to clipboard
Imaging analytics is the extraction of meaningful quantitative information from digital images using software-based image processing and analysis techniques (i.e., algorithms). These techniques can be part of standard software suite, or custom-tailored to a specific application using a combination of advanced image processing filters optimized for speed and precision. Independent of application, approaches to imaging analytics should be validated and automated as much as possible to eliminate observer-bias and to minimize data variability. Examples of image analysis include 2D, 3D and 4D (temporal) object recognition, anatomical feature segmentation, density measurement, morphological characterizations (including volume and shape parameters) and rate of change for these parameters over multiple time points. In essence, imaging analytics enables us to quantitatively measure and track what the human eye can only qualitatively assess.
Drawbacks of Gold Standard, Traditional Image Scoring
In traditional image scoring, images are manually reviewed one after another by a trained technician and then given a score relative to image features that are being measured. For example, a radiologist might confirm (yes or no) or score (1 through 5) for the presence or grade of cartilage damage in a MR image. In some cases, image objects (e.g, cells or lesions) are counted within a defined region-of-interest. These scores or counts, in addition to comments or dictated notes, are compiled into a final data report. Unfortunately, manually scored image data is almost always qualitative, rather than quantitative. Furthermore, this approach to image analysis is time- and labor-intensive, inconsistent, subjective and often fraught with intra-/inter-observer variability. Observer-based image analysis will, by default, introduce subjectivity into measured outcomes that can vary significantly based on the rater’s experience level and training. Thus the reproducibility/precision of reported results is generally low among observers, and impaired even for a single rater depending upon his emotional/physical disposition at the time of image evaluation. Historically, a common way to combat these drawbacks is simply to increase the number of patients or specimens in a study to meet statistical significance. This, of course, significantly increases associated time and cost.
Benefits of Image Analytics
Software utilizing custom-tailored image processing and analysis algorithms to extract a wide range of application-/study-specific measures (e.g., tissue type, implant size/shape/material, anatomical region-of-interest, tissue repair rates, object resorption rates, etc.) can offer significant improvements in terms of performance, precision, quality and quantity of output data. The goal of most customized image analysis algorithms is to mimic visual perception to delineate features in an image in a quantitative manner. In some cases, these algorithms can also detect details or changes within images that even a trained and experienced observer may not see or reliably score. As a result, these algorithms yield highly quantitative and consistent data.
Image analysis algorithms can extract data in either automated or semi-automated routines. In either case, the automation enables batch processing and analysis of imaging data with little or no user interaction or input. This significantly reduces the time and labor traditionally associated with image review and scoring. Automation also minimizes the introduction of user-bias, significantly reduces inter-/intra-observer variability and increases throughput. As a result, analyzed data will be efficiently and objectively evaluated for speedy and sound decision-making. The organization of the quantitative data output by a particular set of analysis algorithms can also be custom-tailored to facilitate statistical analysis by a wide range of statistics programs. The data can also be visualized (2D, 3D or 4D renderings/movies) to enable efficient communication of results to stakeholders (e.g., management, regulatory agencies, physicians, patients, colleagues, etc.).
Taken together, these benefits yield one additional advantage that is particularly important in today’s uncertain economy: cost savings. Not only is the resulting data quantitative and objective, but the reduction in time and labor translates directly to cost savings. In addition, the high precision and accuracy of quantitative imaging analytics enables biostatisticians to justify a reduction in total number of specimens or patients required to meet statistical significance in preclinical and clinical trials, respectively. Depending on the drug, device or biologics under study, this alone can translate into substantial cost savings.
Algorithm Development, Customization and Optimization
The significance of custom-tailored imaging analytics is best illustrated with an analogy. An optimized image analysis algorithm (or set of algorithms) is akin to designing a hammer for hitting a specific nail. Standard software packages, however, attempt to design a universal hammer to hit every type of nail in existence. As a result, while this latter approach may be effective for a defined set of images (similar to the “training” set of images from which the governing algorithm was generated), in general, results will be largely inconsistent and inaccurate. By tailoring image processing and analysis algorithms (as well as image acquisition protocols) on a study or application-specific basis, an investigator can generate quantitative, accurate and objective data.
A major caveat inherent in the development, customization and optimization of image analysis algorithms is the necessity to staff or contract professionals who are adequately experienced in image analysis and software engineering for biomedical applications. Furthermore, since algorithms are study specific, they must be thoroughly validated using expert guidance and verification (i.e., radiologist or pathologist), cadaver models, phantoms, etc. They must also be combined with proper imaging and analysis controls when utilized in preclinical and clinical research and product development.
Applications in Basic and Clinical Science
There are many applications for imaging analytics in basic and clinical science. As a rule of thumb, any image feature can be quantitatively analyzed if a human observer can visually perceive and describe it. Examples include, but are not limited to:
- Quantification and automation of 2D histomorphometry (histology) image measurements across 1,000s of specimens (batch analyses)
- Quantitative spatial co-registration and analysis of patient computed tomography (CT) and magnetic resonance (MR) image data across multiple time points
- Co-registration and correlation of 2D histology and micro-CT data
- In vivo quantification of cartilage repair across multiple time points using MR
- Single cell tracking and quantification of wound healing via cell markers and fluorescence microscopy
- In vivo measurement of bone in-/on-growth relative to an orthopaedic implant using CT or micro-CT
- Automated enumeration of positive vs. negative cells following transfection with an experimental gene therapy
The list could go on and on. What is important to remember is that imaging and imaging analytics are rapidly growing in popularity as their utility in the biomedical community is becoming more commonplace. Although imaging analytics currently plays a large role in many medical fields, few have benefitted more than the field of orthopaedics.
Applications in Orthopaedics
In orthopaedic research and development (R&D), imaging analytic techniques can be tailored to account for many study-specific parameters that can have a significant impact on the assessment of a product’s efficacy. Some of these parameters include imaging modality (i.e., CT, MR, x-ray, 2D histology, etc.), anatomical regions-of-interest, implant material and morphology, rates of tissue growth or repair, rates of scaffold or implant resorption, etc. By employing custom-tailored image analysis algorithms, investigators can quickly and quantitatively assess new bone formation or cartilage health, implant integration or resorption rates via one or more independent imaging methods with little or no user intervention in either a preclinical or clinical setting. Although the following examples represent a mere microcosm of the possibilities available, they provide a rough idea of how some orthopaedic investigators are leveraging imaging analytics to improve their research and product development.
Validated with appropriate specimen-, imaging modality- and image analysis-level controls, these techniques can provide precise, accurate and quantitative metrics that can be used to measure orthopaedic device efficacy in vivo or ex vivo. Furthermore, the output data parameters can be configured according to specific study needs. For example, one study may need to assess the amount of new bone growth around a non-resorbable interference ACL screw, whereas another study may require that the algorithms measure the amount of new bone growth within a porous scaffold (“ingrowth”). A third study may necessitate that measurement of bone/implant/contact region around an implant, requiring that a digital region-of-interest (surface area) be defined wherein the image analysis will be focused. As new parameters are requested, or if old ones need to be changed, the image analysis algorithms can be reapplied to an entire study data set in an automated batch-processing fashion, rather than having an entire team of technicians reevaluate all of the images for the new metrics.
Tissue Repair Assessment
Quantifying composition, morphology and organization of new tissue growth is critical in the characterization of tissue repair. In orthopaedics, 3D images from CT and MR scans are commonly used to define the extent and quality of bone and cartilage tissue repair. This can range from density of newly formed bone to stratification of cartilage. Unfortunately, extracting robust quantitative information from such datasets using manual delineation can be extremely time-consuming. Contributing to this inefficiency is the lack of consistency in patient positioning during image acquisition for temporally spaced imaging sessions. This necessitates that a technician review and score images at multiple time points for multiple spatial orientations. This can generate significant measurement errors and compound the issues related to traditional image scoring.
Imaging analytics algorithms, however, can be employed to rectify this problem by applying co-registration techniques to align temporally acquired image data into a common coordinate system. Subsequently, specific regions-of-interest can be defined for multiple time points, simultaneously enabling extraction of underlying changes in tissue volume, morphology, density, etc. in an automated fashion. As an example, Exhibit 1 on the following page shows a longitudinal set of patient scans in which significant osteonecrotic bone loss in the femoral condyle was produced by a tumor. The defect generated by the tumor was subsequently filled with a bone graft. To quantify the degree of tissue repair (i.e., bone growth integration at defect site), the two CT volumes shown at the top of Exhibit 1 in two drastically different orientations (orientations that the technician would use for scoring), were co-registered. The lower left of Exhibit 1 demonstrates the result of the registration. Finally, the lower right shows a 3D visualization of the quantitative results of the image analysis algorithms wherein new bone growth and density have been measured within the defect site for each of the two time points
Exhibit 1: Bone Regeneration after Tissue Loss Due to Osteonecrotic Tumor
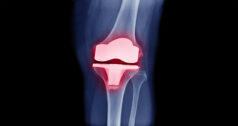
Implant Performance Assessment
Measuring new bone or cartilage growth in a preclinical or clinical setting is often critical for confirming the efficacy of a new implantable orthopaedic device. As an example, Exhibit 2 displays data from a clinical trial in which a resorbable screw was implanted into patients during ACL repair, and CT was used capture image data across multiple time points for each patient. In this study, the investigator wanted to quantify new bone growth at each time point within the tunnel, in addition to tracking changes in screw and cortical bone autograft volume (resorption rates). Image analysis algorithms were used to quantify all of these metrics, with segmented features utilized for data visualization to render the numerical data in a way that would facilitate communication between the investigator and their regulatory agency and customers. The colors—blue, green, red and gray—represent new bone, implant, bone autograft and tibial tunnel, respectively.
Exhibit 2: Assessing Longitudinal Bone Growth and Implant Resorption with CT

Device Design and Quality Control
Imaging analytics is not just for preclinical and clinical trials. Biomedical imaging and image analysis can even be used to assess and confirm a material’s suitability for a given implant and anatomical site. This is in addition to aiding researchers and engineers in properly designing an implant for a particular indication. For example, micro-CT and customized image analysis algorithms can be employed to define bone tissue architecture within a given anatomical region-of-interest such that an implant’s own architecture can be designed to mimic the trabecular and cortical bone in hopes of enhanced implant stability, integration and tissue repair post-implantation.
As another example, Exhibit 3 demonstrates the use of Micro-CT and clinical CT in the quality control of two orthopaedic screws. In Exhibit 3A, a volumetric accuracy assessment of automated image analysis algorithms was applied to a screw segmented from a patient’s CT scan of the tibia. This same screw was scanned on both a clinical CT (Exhibit 3B) and a micro-CT (Exhibit 3C) prior to implantation with Exhibits 3B and 3C displaying isosurface renderings on the left and orthogonal planar views on the right. From these data the investigator determined that there was a one percent volumetric variation between non-implanted screws and an eight percent difference between implanted and non-implanted screw volumetric analysis. The increased volumetric variation difference was attributed to in vivo bioresorbable implant swelling. Lastly, Exhibit 3D shows an image-based precision analysis of femoral metallic screw volumes segmented from temporally acquired clinical CT scans. Here, the implant engineers were able to confirm a four percent variation in screw volume which could then be accounted for in subsequent, appropriately powered preclinical and clinical trials.
Exhibit 3: Evaluation and Quality Control of Implantable Screws via CT and Micro-CT

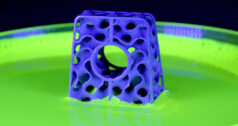
Scaffold and Biomaterial Evaluation
Measuring the performance of a biomaterial in vivo and ex vivo is an important part of developing implantable scaffolds designed to enhance new tissue formation and repair. Imaging and image analysis can help investigators make informed decisions regarding which material is optimal for a given application. For example, micro-CT can be utilized to quantify and track a dense material’s (e.g., magnesium) degradation over time while simultaneously quantifying the production of byproduct (e.g., hydrogen bubble) and any changes in the original object’s volume. For implants that will remain in the body for extended periods of time or those designed to be resorbed, these measurements can enable an investigator to make informed decisions regarding implant material properties, amount and optimal location.
Imaging analytics can also help quantify scaffold performance. As another example, Exhibit 4 shows the evaluation of a biomaterial scaffold in a preclinical rabbit calvaria model. The goal of the study was to assess new bone growth across a critical size defect. Briefly, Exhibits 4A and 4B are Micro-CT volumes of the implanted biomaterial scaffold (sagittal view at top; transverse view at bottom) and the bone tissue punch extracted from a critical-sized defect created in a rabbit skull. Exhibit 4C is a micro-CT volume of an excised portion of a rabbit skull implanted with the biomaterial scaffold wherein the denser (e.g., brighter) material within the defect is quantified as new bone growth (verified via histological sectioning and staining). Lastly, Exhibit 4D is a negative control for the scaffold in which the critical defect was implanted with a different scaffold biomaterial that does not promote bone in-growth.
Exhibit 4: Evaluation of Preclinical Biomaterial Scaffold Performance via Micro-CT

Benefits to Orthopaedic R&D
Imaging analytics offers many benefits to the orthopaedic research and product development community. Image processing and analysis automation (i.e. batch analysis) using custom-tailored, robust algorithms can enable investigators to improve the quality and breadth of their data. This approach also significantly minimizes inter-/intra-variability, increasing one’s ability to quantify image measurements, rather than having to rely solely on subjective opinions. Thanks to the automated and high-throughput nature of imaging analytics, an investigator can avoid having to sub-sample their data. This reduces large time and cost barriers associated with traditional manual image review and scoring. Furthermore, employing batch image processing and analysis techniques provides the ability to reanalyze an entire image dataset multiple times, if necessary, to generate additional parameters or account for adjustments in a study’s goals.
In addition to improving various aspects of R&D data, there is a compelling financial case for utilizing customized image analysis. Depending on the sophistication and volume (specimen or patient cohort size) of image analysis required, substantial cost and time can be removed from a research study or product development program.
In some cases, the reduction in costs can be attributed to the automation of manual steps for counting/tagging or tracing regions-of-interest or image features. In other cases, image processing and analysis routines that have been customized for a given study or project will make medical professionals, technicians and engineers more efficient in completing their work. Lastly, when quantitative data is derived from algorithms that provide a high level of precision and accuracy, fewer specimens or patients are required to reach statistical significance for product efficacy end points. This alone can dramatically reduce the costs associated with a multi-year orthopaedic program or study.
Conclusion
The image acquisition and analysis components of orthopaedic R&D can be quite complex. Harnessing the power of imaging analytics and incorporating them into a research study or product development program can yield benefits that more than justify any initial time or cost investment. Once employed, these techniques can significantly augment (or even replace) traditional subjective observer evaluation.
The resulting automated and quantitative analysis enables faster throughput for larger sample sizes or patient cohorts, informed and earlier decision-making ability, improved statistical power and/or a reduction in the total specimen/patient cohort requirements due to improved data precision and accuracy. By employing image analysis algorithms validated with appropriate controls, investigators can remove time, cost and guesswork from orthopaedic research and product development, and substantially enhance their ability to communicate their study results or product value proposition to key stakeholders.
Amit Vasanji, Ph.D., in his role as Chief Technology Officer for ImageIQ, relies on more than ten years of experience with basic and clinical research image acquisition, processing, analysis, visualization and software programming. He was the founder of Cleveland Clinic’s Biomedical Imaging and Analysis Center, and served as its executive director from 2005 until 2011. During his tenure at the Cleveland Clinic he authored more than 30 publications, many in high-impact journals, participated in the writing of numerous funded grants, served as a consultant and co-investigator on Federal, state, corporate and institutional grants, presented at national scientific meetings and won numerous awards for innovation and service. Dr. Vasanji received a B.S. in Biomedical Engineering from the University of Miami, and a Ph.D. in Biomedical Engineering from Case Western Reserve University.
As a vice president at ImageIQ, Brett Hoover, M.S. relies on nearly ten years of experience as a biotechnology and life science researcher, product manager and commercialization specialist. He served as a product manager for the Clinical Tissue Engineering Center and as a commercialization specialist for the Armed Forces Institute for Regenerative Medicine, both located at Cleveland Clinic. In 2004, Mr. Hoover was awarded the National Institutes of Health’s Young Investigator Grant Award for his work with stem cells and tissue engineering, and in 2010 one of his technology projects was awarded $2.2 million through the Ohio Third Frontier Commercialization Program. In 2009, one of his early-stage technology startup companies was a semi-finalist at the Oakridge National Labs Global Venture Challenge. Mr. Hoover has a B.A. in Biology, Chemistry and Art History, and a Master’s in Cell and Molecular Biology and Entrepreneurial Biotechnology, all from Case Western Reserve University.
ImageIQ, Inc.