


 Copy to clipboard
Orthopaedic industry revenue reached $49.3 billion worldwide in 2017 and grew at 3.7%, ~$1.7 billion over 2016, according to our estimates in THE ORTHOPAEDIC INDUSTRY ANNUAL REPORT®. Further, we predict industry revenue to surpass $59 billion by 2022.
The 20 largest orthopaedic device companies, which combined make up 76% of the market, posted growth in 2017, which is a statement that we haven’t made for at least the last five years. Orthopaedics—and healthcare in general—is in a transformative time. Globally, it’s recognized that the rising cost of care must be curbed while simultaneously, patient outcomes must be improved. Orthopaedic device companies have made bold decisions in heeding demands of their hospital customers. We believe that the 20 largest companies (and, of course, the hundreds of smaller ones) posting revenue growth in 2017 demonstrates that orthopaedic players are, for the most part, optimally adjusting to the new environment.
How are companies responding in order to fuel growth? Product launches, acquisitions and international expansion were among the most-cited contributors by company executives.
Of course, each market segment has its own set of forces and trends—its own story. A few high-level observations are bulleted below and substantiated in Exhibits 1 and 2.
Exhibit 1: Product Segment Performance 2017 vs. 2016 ($Millions)
| 2017 | 2016 | $ Change | % Change | |
| Joint Reconstruction | $18,119.0 | $17,558.7 | $560.3 | 3.2% |
| Knee | $8,783.3 | $8,533.8 | $249.5 | 2.9% |
| Hip | $7,225.7 | $7,071.5 | $154.2 | 2.2% |
| Extremities | $2,110.0 | $1,953.4 | $156.6 | 8.0% |
| Spine | $9,080.9 | $8,883.7 | $197.2 | 2.2% |
| Trauma | $6,920.0 | $6,614.8 | $305.2 | 4.6% |
| Arthroscopy/Soft Tissue | $5,318.5 | $5,009.7 | $308.8 | 6.2% |
| Orthobiologics | $5,097.1 | $4,946.2 | $150.9 | 3.1% |
| Other* | $4,833.3 | $4,572.8 | $260.5 | 5.7% |
| Total | $49,368.8 | $47,585.9 | $1,782.9 | 3.7% |
*Other contains CMF, bone growth stimulation, bracing/soft goods, etc.
Exhibit 2: 2017 Orthopaedic Product Sales by Market Segment
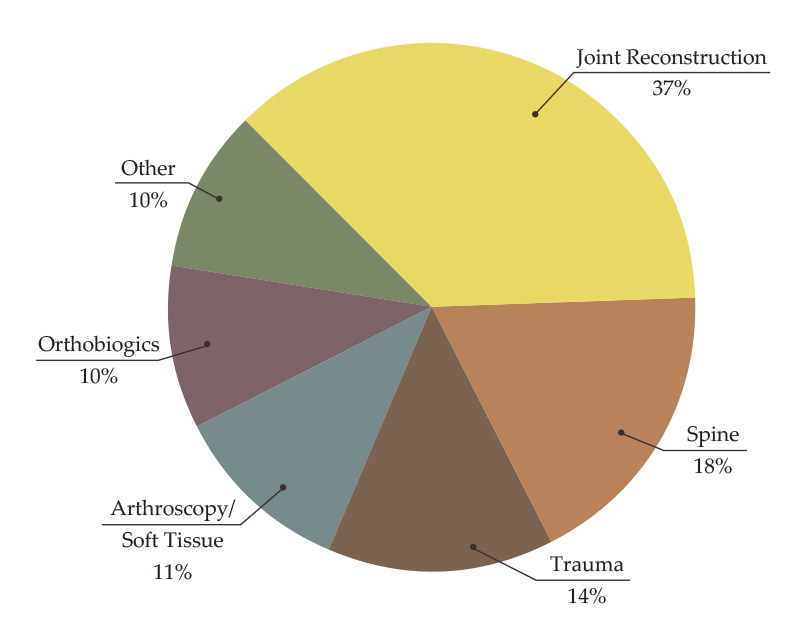
Joint reconstruction and spine, the two largest segments by revenue, together account for 55% of orthopaedic market revenue. Companies of all sizes within these segments continue to vocalize that payors and hospitals are pushing back on implant prices and demanding proof that products will perform as marketed. The year-over-year growth of the hip, knee and spine markets is partially attributed to this payor and hospital scrutiny.
Growth in the trauma market is largely driven by patient demographics and the need to heal broken bones. New products in 2017 came from all sorts of companies: top trauma players, those well-established in other segments and startups, as well, which drove market growth.
Arthroscopy/soft tissue repair benefits from a younger, educated population that seeks to return to an active lifestyle. This market is dominated by seven players that control more than 90% of the market. These companies are actively launching new products for new indications, which ultimately leads to revenue.
Orthobiologics are used across all orthopaedic segments. The faster-growing portions of the segment come from the use of products in soft tissue repair and spine.
The pressure surrounding price and value will persist across the industry and will compel device companies—and their supplier partners—to remain fiercely attentive to their customers’ voices in order to maintain competitiveness and margins.
The reality is that a greater level of transparency and continuity is expected today. From a transparency perspective, patients increasingly educate themselves on their procedures and care; payors and hospitals fixate on the cost of care pre-op through 90-days post-op; regulators require more evidence to validate efficacy and safety for market clearance. In response to these shifts, orthopaedic device companies must arm themselves with data that proves the results of their product’s intended performance and substantiates its price.
From a continuity perspective, the focus on episode of care presents myriad challenges for hospitals, surgery centers and surgeons, and thus opportunities for device companies that are able to expand their portfolios beyond traditional hardware or engage in risk sharing agreements. Further, supplier and service providers at the far end of the chain provide a critical role of support as device companies seek to outsource a greater portion of the commercialization process while they concurrently decrease their number of vendors. All companies must have a thorough understanding of the drivers fueling their customers’ purchasing decision.
This article is excerpted from the Executive Summary of THE ORTHOPAEDIC INDUSTRY ANNUAL REPORT®. The report covers five orthopaedic market segments and contract manufacturing sector, providing an in-depth review of growth drivers, a list of top 10 companies, overview of new players and revenue projections through 2022.