Copy to clipboard
The significance of in vivo investigation has become increasingly important as bone substitutes have grown in structural and compositional complexity. The diversity of parameters currently expected from osseointegration studies, combined with patient or animal population-based variability in reaction/response to such surrogates, necessitates unrealistically large cohorts for adequate power and ultimate statistical significance using standard ex vivo histological assessment. Unfortunately, such large sample sizes translate to increased animal or per-patient costs and exponentially higher turnaround times for sample evaluation.
Recently, with its ability to provide accurate and reproducible bone metrics less susceptible to observer-based bias, use of imaging analytics has gained significant traction to enable efficient assessment of larger ex vivo sample numbers. While this automated approach provides a solution that addresses throughput issues in large studies, the associated costs stemming from animal housing or patient enrollment to sample prep and processing can significantly impact feasibility. Fortunately, the combination of in vivo investigation with novel but validated image analysis techniques 1) drastically reduces the burden of proof required to account for patient/animal population variability as subjects, each with their own baselines for normalization, are followed longitudinally, 2) provides consistent, accurate metrics that can be compared across time points without corruption by user interaction or subjectivity, 3) eliminates the need for sub-sampling employed to reduce costs, 4) provides quantitative and visual evidence of analysis output metrics for marketing or regulatory submissions and 5) lowers statistical variability to enable reduction in the size of animal/patient cohorts.
Ex vivo Assessment
Traditional Histological Evaluation
Histological sectioning and staining of explanted tissues is the current “gold standard” for assessing bone ingrowth into porous, defect-filling scaffolds, bone remodeling around solid implants or fixation hardware, and fracture healing in both research and regulatory realms. Using high resolution optics, histological evaluation enables both gross ultra-structural/organ-level interrogation and visual sensitivity down to the cellular-level. Furthermore, the availability of numerous stains and antibodies, both fluorescent and bright-field allow delineation of tissue types or presence and localization of specific proteins with submicron precision.
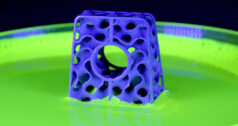
Unfortunately, the valuable information gleaned comes with a significant price tag and lengthy turnaround times. Consider the bone implant shown in Exhibit 1 (A & B). To cross-section and stain the porous scaffold completely would require ~200 slices at 100 um intervals to cover its 2 cm diameter. At a conservative rate of $50/section for histological processing/staining, a single sample would require a $10,000 investment and an optimistic 3-6 month turnaround. Additionally, once the sections are generated, a pathologist or multiple “trained” observers are engaged to grade each section and provide a qualitative score for bone ingrowth, lengthening timelines yet again. Obviously pursuing such an aggressive histological survey is not feasible from the standpoint of either cost or efficiency. Thus, most researchers will drastically reduce the number of sections generated to stay within a specific budget and meet appropriate deadlines.
Exhibit 1: Pre-clinical Implant Osseo-integration
- Histological cross-section of femur with implanted biomaterial (black).
- Magnified view of orange rectangle shown in A.
- Pseudo-colored representation of automated analysis output where green delineates segmented implant material and blue indicates newly formed bone.
- Magnified view of orange rectangle shown in C., auto-generated red line outlines implant border and double yellow lines represent +/- 250 um from the implant border for “on-growth” analysis.
- Micro-CT orthogonal views of sample shown in A.
- Pseudo-colored, isosurface rendering of volume in E., where green represents segmented implant material, yellow delineates region of interest defined for analysis, and red indicates the analysis output for bone ingrowth.
ImageIQ would like to acknowledge and thank Sona Sundaramurthy and Biomet, Inc. for support in generating, and the use of, the data shown in this exhibit.
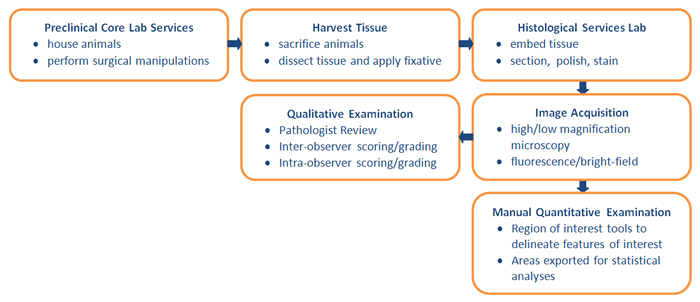
Unfortunately, in limiting the number of sections evaluated, the ability to accurately define levels of bone integration is significantly diminished, especially for amorphous materials where bone ingrowth can vary significantly throughout the interstices of the biomaterial. Such sub-sampling can add to the already existing population variability within a cohort of subjects, confounding the reliability of subsequent qualitative examinations. At the very least, under-sampling will result in reduced statistical significance. More damaging, however, incorrect interpretation due to sample binning can contradict true implant performance. The typical workflow for histological evaluation is shown in Exhibit 2.
Exhibit 2: Typical Workflow for Histological Evaluation
Micro-CT Evaluation
Though a commonly utilized bone visualization and analysis tool for many research institutes and academic centers, micro-computed tomography or micro-CT has only recently garnered attraction in regulatory circles. Unlike histological evaluation, micro-CT cannot provide high-resolution delineation of a wide variety of tissue types and proteins. However, it can provide classification of tissue types based on density, ideal for bone tissue evaluation (i.e. cortical, trabecular, woven, etc.). Additionally, micro-CT imaging enables volumetric visualization and analysis of a sample in its entirety and is non-destructive, permitting subsequent histological assessment.
Revisiting our example in Exhibit 1A & B, imaging the porous material using micro-CT prior to histological sectioning would provide 1,000 slices using a scanning resolution of 20 um at an average cost of $300 to $400/sample (Exhibit 1E). This is a significant cost-savings over exhaustive histological surveys. Furthermore, micro-CT imaging enables the acquisition of data across the entire implant in a single scan, providing faster throughput than a histological approach without the need for sub-sampling to remain within budget constraints.
There are, however, two main drawbacks to micro-CT based bone analysis. First, while resolution in the slice direction can be much higher with micro-CT imaging, the in-plane resolution cannot approach that of histological microscopic imaging. At best, current micro-CT imaging systems can scan at voxel resolutions approaching 1 um. Fortunately, for the purpose of bone growth and remodeling assessment, such resolutions are more than adequate and in fact comparable to low magnification histological grading that is generally conducted on large samples. Secondly, micro-CT imaging is largely ineffective in delineating low density soft tissues, and often corrupted by artifacts when imaging very dense materials such as metals. It is possible, however, to increase current to improve tissue contrast (applicable to ex vivo imaging only due to increased radiation dose), or increase voltage to reduce metallic streaking artifacts. These issues notwithstanding, micro-CT imaging can be an effective tool to supplement histological evaluation by providing a more thorough interrogation of bone ingrowth than a purely histological approach.
Customized Image Analysis
Qualitative histological grading/scoring for bone growth or remodeling presents a major bottleneck for throughput and more importantly can produce erroneous conclusions resulting from the inherent subjective interpretation. Experience level, workload, mental disposition, workplace distractions, lighting, viewing media color calibration and time of day are just a few of the factors that impact the ability of a trained observer to consistently and accurately grade histological samples. If it were possible to control for all of these factors, the final result of such an approach is still a singular value that is not quantitative in terms of localization, absolute quantity or morphology. This reader-based approach originates from the healthcare radiology model that suggests that a trained, experienced reviewer such as a radiologist or pathologist can accurately define degree of pathology or efficacy upon visual inspection, drawing upon thousands of similar images or cases that they have reviewed to formulate an opinion. Obviously this model is well established and validated, and is absolutely accurate when it involves decisions regarding presence or absence of pathology or a relative degree of pathology on a standardized scoring scale. Unfortunately, it is not at all quantitative and prevents reliable comparison across samples/patients over multiple time points and observers.
For instance, a cartilage defect on a MRI can be assigned a grade 3 (ICRS grading scale) to indicate the lesion appears to have extended >50% through the cartilage depth. The score does not indicate the actual depth of the lesion, its depth in across multiple axes or its overall volume. Similarly, observer based analysis of histological samples for bone ingrowth (Exhibit 1A & B) produces a single value that doesn’t contain absolute area measurements for newly formed bone, its location or normalization for the area of void space that can vary significantly from slice to slice and actually dictates the area in which bone growth is even possible.
These pitfalls, along with the need for complex quantitative parameters that aren’t easily translated into a simple scoring system, have caused most academic institutes to abandon traditional scoring systems in favor of customized image analysis routines that are faster, more precise, quantitative and less subjective than observer grading. An example of bone ingrowth image analysis applied to both 2D histological samples and 3D micro-CT volumes is shown in Exhibit 1C & D. Segmentation of the appropriate staining hues of the scaffold material (black) and newly formed bone (purple), an automated algorithm was developed to delineate the scaffold boundary, new bone formation within the scaffold and bone growth between the scaffold and native bone (“on-growth”). Similarly, this algorithm was extended to three dimensions to enable extraction of volumetric parameters for new bone ingrowth and scaffold material from micro-CT data acquired prior to histological processing (Exhibit 1F). While observer-derived scores for bone ingrowth correlated well with bone ingrowth percentages extracted from automated analysis routines, histological evaluation produced over- or under-estimation of bone ingrowth (Exhibit 3A) compared to micro-CT-based volumetric measurement (Exhibit 3B)- illustrating the impact of histological under-sampling.
Exhibit 3: Automated Analysis of Bone Ingrowth: Histology vs. Micro-CT
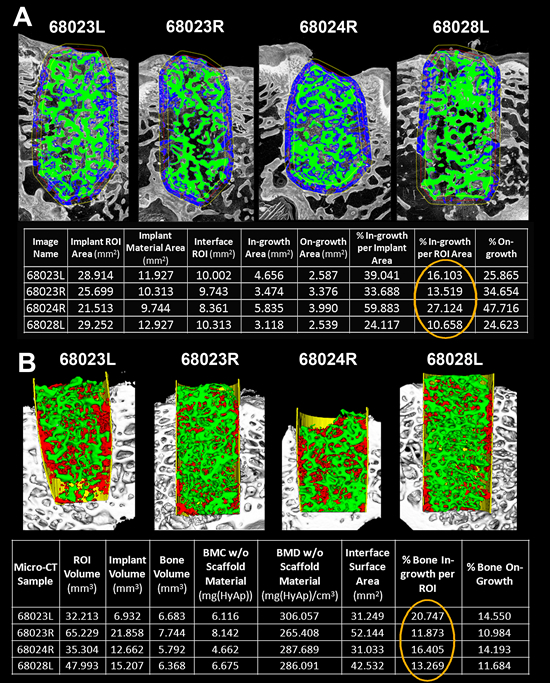
- Pseudo-colored representation of automated histological analysis for 4 femurs implanted with a porous biomaterial. Green delineates segmented implant material and blue indicates newly formed bone. Table below shows output parameters generated by the analysis for each sample. Orange circle highlights % Ingrowth.
- Pseudo-colored, isosurface rendering of the same 4 samples in A. following micro-CT imaging and automated analysis. Green represents segmented implant material, yellow delineates region of interest defined for analysis, and red indicates the analysis output for bone ingrowth. Table below shows output parameters generated by the analysis for each sample. Orange circle highlights % volumetric bone ingrowth.
ImageIQ would like to acknowledge and thank Sona Sundaramurthy and Biomet, Inc. for support in generating, and the use of, the data shown in this exhibit.
In vivo Assessment
Longitudinal Micro-CT/CT Imaging & Analysis
As discussed in detail above, animal and patient numbers in studies or trials can grow extremely large to meet power criteria for statistical significance and adequately control for population variability. To account for such variability and ultimately reduce number of subjects required, a longitudinal in vivo approach can be utilized that follows bone remodeling/growth within the same animal or patient, enabling normalization of metrics to subject-specific baseline values. In the case of animal studies, this can drastically reduce the number of animals that are sacrificed and histologically processed at each time-point of interest. Instead, each animal may be scanned at various time points on a clinical CT (larger animals such as rabbits, dogs, etc.) or micro-CT (mice and rats) and sacrificed at the end of the study for histological evaluation. This approach is not only more cost effective than a purely histological approach, but provides comprehensive, volumetric data obtained in a more humane fashion.
Illustrated in Exhibit 4A, a longitudinal assessment of scaffold osseointegration was performed in a rabbit calvaria (skull) defect model over multiple time points to determine rate of bone ingrowth. To account for positional inconsistencies between time points and enable voxel to voxel comparison of bone ingrowth and density changes across all time points for a given animal, each animal’s longitudinal volume was spatially co-registered to its baseline volume (mutual information algorithm). Subsequently, output volumetric parameters and bone density metrics were extracted using automated gaiting algorithms applied to a predefined volume of interest within the defect site (volume of interest was placed in the same location for each animal since all longitudinal volumes were spatially registered). Since these temporal rabbit scans were performed on clinical CT with much lower resolutions than available on micro-CT systems (300 um vs. 20 um), the final time-point volumes acquired with clinical CT immediately prior to sacrifice were co-registered to micro-CT volumes of the same scaffolds imaged following retrieval to ensure validity of clinical CT metrics. As shown in Exhibit 4B, there was in fact a high degree of correlation between the two modalities with regard to bone ingrowth despite the drastically dissimilar resolutions.
Exhibit 4: Longitudinal Assessment of Bone Integration using Clinical CT and Micro-CT.
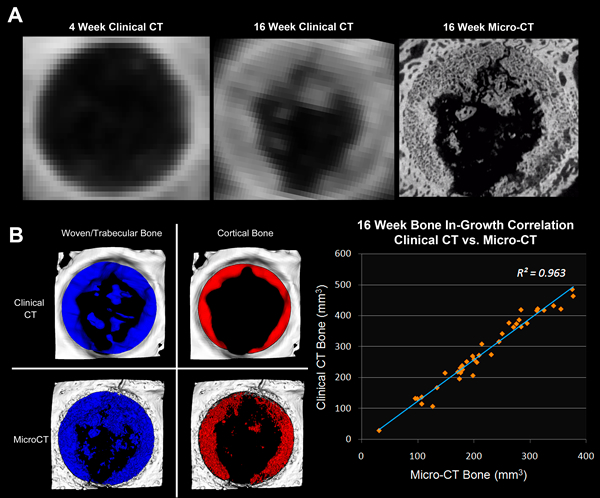
- Axial views of spatially co-registered longitudinal volumes of a porous scaffold implanted into a rabbit skull defect. Left: 4 week 64-slice CT; middle: 16 week 64-slice CT; 16 week micro-CT of explanted scaffold.
- Correlation of segmented bone ingrowth (woven bone = blue; cortical bone = red) for 16 week clinical CT (top) and 16 week micro-CT (bottom). Graph shows linear correlation between micro-CT and clinical CT bone growth analysis for 38 samples.
In clinical studies, acquisition of longitudinal data, baseline scans in particular, is absolutely crucial for bone osseointegration analysis. Baseline time points provide the initial defect size, starting density, location and orientation of any biomaterial, graft, screw, etc., and the density and quality of surrounding native bone. As described above for in vivo animal studies, volumetric co-registration of post-op time points to baseline scans enables normalization of endpoint bone-growth metrics to account for variability in initial defect volume from patient to patient. Furthermore, subsequent analysis of registered volumes also allows characterization of biomaterial or hardware resorption, immune response or component motion, as well as remodeling and density changes of native bone. Performing single, end-point analysis does not provide the ability to extract “rate” based metrics, normalize for patient variability or permit reliable parameter comparisons across patients. As a result, larger patient cohorts are required to reach statistical significance, straining already bloated trial budgets.
Longitudinal Histological Evaluation
In general, histological evaluation is performed within specific anatomic regions after animal sacrifice and dissection. Therefore, it would seem strange that “longitudinal” evaluation of bone growth could be possible using a histological approach. However, exploiting fluorescent bone markers that label newly formed mineral on bone surfaces, one may determine rate of bone growth over a time period. For example, animals may be injected with a calcein dye followed by an alizarin dye injection one week later. These dyes do not produce any significant side effects or reaction in animals (alizarin has been used in clinical practice to detect mineral in synovial fluid) and stain calcium in newly formed mineralized bone matrices. This approach is demonstrated in Exhibit 5 for a rat model.
Following the last dye injection, the each rat is sacrificed and specific bone anatomy dissected, in this case the distal tibia, and histologically sectioned (no staining required). Using fluorescence microscopy, the injection of the two dyes forms two labeling lines. Consequently, the separation distance between two fluorescent labeling lines along trabecular, endosteal and periosteal surfaces indicates bone growth rates for these components between the injection time points. As indicated in the Exhibit 5B, these separation lines are not necessarily uniform or continuous for each surface. Thus, manually drawing distances between the lines can result in under- or over-representation of growth depending upon the number of lines defined and can be extremely time exhaustive.
However, using image analysis algorithms that utilize spectral enhancement and morphometric filters, it is possible segment each labeling line, extract corresponding separation areas and determine the thickness of every pixel along the medial axis of these separation regions. These thicknesses can be averaged together and divided by the injection interval to provide mean bone formation rate and visually presented using a pseudocolored scale, as shown in Exhibit 5C. This method presents a unique and cost-effective means to assess bone growth without sacrificing high resolution capabilities of histological evaluation. As discussed, performing this analysis is possible using longitudinal micro-CT imaging; however, resolution must be limited to 15-20 um/voxel for this modality to avoid large radiation doses accumulating over multiple time points that could create a significant health risk to animals.
Exhibit 5: In vivo Longitudinal Histological Assessment
- Axial histological cross-section of a rat tibia imaged using fluorescence microscopy. Left: alizarin channel (1st injection). Right: calcein channel (2nd injection – 1 week post alizarin administration).
- Overlay of calcein and alizarin channels with a magnified view indicating separation of the calcein and alizarin labeling lines.
- Pseudo-colored map of the separation distance (i.e. growth) between the labeling line. Magnified view shown on the right with color scale indicating increasing distance values from blue to red.
Longitudinal histological evaluation of bone growth can also be performed in the clinical setting. For this procedure, tetracyline, a autofluorescent antibiotic that binds to active bone forming sites, is administered at multiple time points to generate the double labeling lines described above. Following the last injection, a bone core is obtained from the illiac crest via needle biopsy. The bone core is then embedded in methacrylate to preserve tetracyline fluorescence, and histologically sectioned for visualization with fluorescence microscopy (UV excitation). Automated analysis of labeling line distances can be performed as described above to determine mean bone growth between injection time points. This method has been used to detect renal osteodystrophy and osteoporosis, and assess the therapeutic effects of anabolic treatments.
Additional In Vivo Imaging Modalities
Typically, bone remodeling due to fracture, osteoporosis, bone metastasis or other pathologies are monitored using x-ray based, noninvasive imaging modalities such as CT, direct or computed radiography (i.e. conventional x-rays), or DEXA (Dual-energy x-ray absorptiometry) due to the x-ray attenuation properties of bone that provide excellent differentiation/contrast from surrounding soft tissue. Recently, other modalities such as positron emission tomography (PET) have shown promise in assessing in vivo bone turnover. The PET tracer 18F (fluorine) has the ability to chemiabsorb to hydroxyapatite in bone and has been shown to correlate with osteoblast number and activity and detect osteoporosis. Similarly, performing quantitative bone scintigraphy (QBS) with single-energy photon emission computed tomography (SPECT) has been demonstrated to detect bone loss resulting from osteoporosis, bone metastasis and renal failure. In this technique, technetium-99m methylene diphosphonate is injected into a patient and uptake into bone is quantitatively accessed in SPECT imaging data acquired over multiple time points. Rate of uptake is then used as a measure of bone remodeling (lower uptake in older patients). Like DEXA analysis, however, both PET and SPECT based bone metrics are highly variable across the human population, and thus are only used to provide relative indices for longitudinal progression of pathology within a given patient.
Conclusion
Longitudinal, in vivo imaging studies conducted to assess bone ingrowth into defect-filling biomaterials or voids, callus formation following fracture, implant reaction, resorption or motion and bone remodeling as a consequence of disease state and therapeutic intervention can provide significant advantages over singular endpoint imaging studies involving 3D acquisition modalities or traditional histological approaches. These advantages include:
- Cost-savings – Electing to perform histological evaluations at multiple time points necessitates larger cohorts of animals, since animals are required to be sacrificed at each time-point followed by multiple rounds of histological processing and staining. More animals translates to increased housing, histological processing and analysis costs. Conversely, imaging animals with in vivo modalities such as micro-CT/CT permits analysis of bone metrics at each time-point for the same animal, drastically reducing animal numbers and associated financial burden.
- Shortened timelines – In vivo assessment negates the requirement for multiple histological processing/staining procedures to be conducted each time-point. Since histological processing is generally outsourced and involves lengthy turnaround times, an in vivo approach can dramatically improve efficiency.
- Improved statistical significance – Conducting multi-timepoint studies in which pathology-related bone remodeling, fracture healing, or defect fill is not followed longitudinally within the same animal or patient requires larger cohorts to account for population variability. Unfortunately even with these large subject numbers, such variability may still corrupt output metrics and prevent reliable comparison of data across patient or animal treatment groups.
- Normalization and improved accuracy – Longitudinal imaging and subsequent analysis enable normalization of each patient’s or animal’s metrics to their baseline values. For example, in osseintegration studies examining bone ingrowth following ACL repair, surgically generated tunnels (void region) can vary significantly from patient to patient. Without knowledge of this baseline tunnel volume, an endpoint analysis of bone ingrowth volume cannot be used to accurately define percent fill.
The above advantages are further enhanced when in vivo bone imaging studies are performed in conjunction with automated and customized imaging analytic techniques tailored to specific imaging modalities, anatomical regions of interest, implant material morphology and pathology. Using these techniques, researchers can volumetrically register longitudinal time points and quickly and quantitatively assess new bone formation within defects, implant integration or resorption rates, component motion, fracture healing and bone quality without user intervention. Validated with appropriate controls, these techniques can provide quantitative and reproducible metrics that can be used to accurately assess implant efficacy. These output parameters can be customized and configured according to specific study needs.
As new parameters are requested, they can be reapplied multiple times using batch mode operations. Consequently, the time, cost and guesswork associated with preclinical and clinical R&D programs are greatly reduced.
Amit Vasanji, Ph.D., in his role as Chief Technology Officer for ImageIQ, relies on more than ten years of experience with basic and clinical research image acquisition, processing, analysis, visualization and software programming.