


 Copy to clipboard
Industry has lost its way—maybe industry never had it. Performance efforts almost always have to navigate a maze of conflicting opinions and methods. The results of this approach have not been good. It’s easy for managers chasing performance improvement to get disoriented, and more than a few have moved on to different jobs because they got lost in the maze at their previous job.
Consider the following:
- Lean failure rates are regularly quoted as being between 50% to 98%, depending on the expert. An Industry Week survey in 2007 (433 anonymous respondents) reported that only 24% of Lean implementations achieved significant results.1 On the other hand, it is curious that so many companies and consultants tout Lean, yet there is no verifiable data that links it to financial success. I think a primary reason Lean is so popular is because it’s easy to communicate “Eliminate Waste!” as a slogan and management needs a good, simple rallying cry to help focus workforce efforts.
- 60% of Six Sigma efforts do not meet expected results.2
- 90% of megaprojects (>$1BB) in construction have cost overruns greater than 50%.3
Do these results foreshadow the destruction of the maze? Hardly. At least, not in the foreseeable future.
The “…Post-Lean/Six-Sigma World…” in the headline does not mean a world without Lean and Six Sigma. An alternative approach is operations science, allowing executives to start from well-established first principles and build business success. Advice from any number of experts can, and should, be considered. But decisions are guided by practical, scientific principles that govern all operations. The following is the definition of operations science, some explanation of that science and a quick example of practical application.
Science of Operations
It is remarkable that, until recently, there has been no science of operations management defined in the 200 or so years since the start of the Industrial Revolution. At least, I didn’t find any definition when I searched Google. Certainly, there is science applied in operations management. Operations Research as a field has applied highly-sophisticated math and analysis to operations. This is not the same as defining and promulgating a fundamental, comprehensive operations science. Operations Research tends to be so complex that the average executive makes little or no use of it, unless a Ph.D. is hired to do the analysis. At the other end of the spectrum are myriad continuous improvement brands that have sprung up over time, e.g. Lean, Six Sigma and Theory of Constraints. None of these provide a fundamental comprehensive operations science.
Additionally, there are software vendors selling whatever software the client will buy, with industry analysts writing sponsored “studies” to generate revenue. The final word on success or failure usually rests with a company’s finance and accounting executives who often have their own models of how to get the best results.
It took two Industrial Engineering Ph.Ds. (with undergraduate physics degrees), Wally Hopp and Mark Spearman, to recognize this fundamental shortcoming in operations management and to propose a general, comprehensive operations science in the textbook, Factory Physics.4 The concepts have been relentlessly and successfully tested in industry over the past decades but often get lost in the general confusion surrounding highly popular efforts, such as Lean and Six Sigma.
The definition of operations science is: Knowledge of the general truths about converting material and labor into goods and services. It is concerned with the fundamental principles governing demand, cost, variability, capacity (machines and people), inventory and time (customer service).
Operations science is also the practical analysis and application of those relationships so operations become more effective with people and efficient in action, profitable and easily managed.
Defining a Perfect World
Science is the process of observing nature, making hypotheses about the performance of systems of nature, testing those hypotheses and then determining whether or not a hypothesis can be rejected. If repeated, tests do not provide evidence that the hypothesis can be rejected; the hypothesis is provisionally held to be an accurate representation of system behavior. For instance, a manager might make the hypothesis that it is most beneficial for profitability and customer service to run a production operation with zero finished goods inventory. If the business is one where the market requires lead times shorter than the time required to make the product, the manager will quickly be on to “new career opportunities” when the hypothesis is tested by eliminating all finished goods inventory. Orders will be late, customers will be unhappy and revenue will suffer accordingly. The succeeding manager will then, hopefully, factor the need for finished goods inventory when making observations about how the business system behaves. Future hypotheses will be about how much inventory is needed rather than whether inventory is needed.
To propose hypotheses for operations science, it’s useful to propose what a perfect world would look like as an upper limit to performance. The perfect world for any operations or supply chain or service is fairly simple to describe, but it is instructive for those managers who consider making perfect performance a “stretch goal.”
In a perfect world, all demand is met instantly at minimum cost. This means there is 100% customer service, zero raw materials and zero finished goods inventory because suppliers show up with the correct material exactly when needed and, as soon as something is produced, a customer shows up to buy exactly that product. All resources (machines and people) are 100% utilized and there are no quality defects. In this perfect world, a business meets all demand—on-time at minimum cost—so it achieves maximum profitability and cash flow with 100% customer service. Managers attempting perfect performance are guaranteed to fail. What is needed is a practical, general model describing real-world operations and their behavior.
General Model of Real World Operations
“Factory Physics” concepts contain the following general model of work systems:
- All operations, whether they are supply chains, production processes, civil infrastructure projects, product development processes or hospital emergency rooms, are composed of two primary elements: demand and transformation (or supply).
- Transformation is composed of two structural elements: stocks and flows. Transformation is a flow into a stock and demand is a flow out of a stock, shown below in Exhibit 1.
Exhibit 1: Demand Stock Flow Diagrams

The construct of demand and transformation, stocks and flows is completely scalable and general so it can be used to represent a single product line, an entire supply chain, a product development process, a hospital emergency room, an oil well drilling operation or an airport terminal construction project. These are all examples of real world applications to which the science has already been successfully applied.
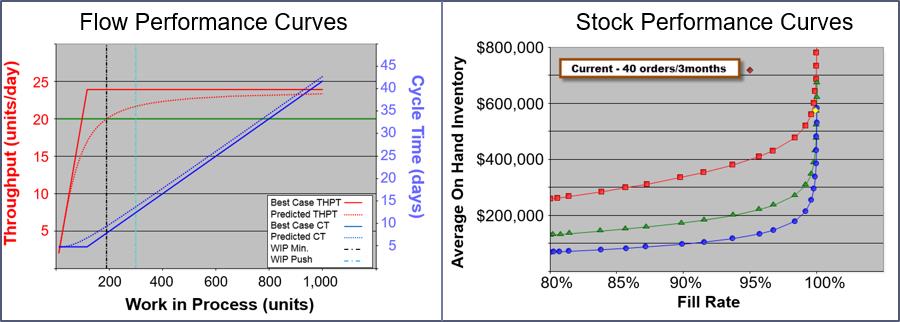
The construct of operations as a network of stocks and flows is vitally important to operations science, because performance curves can be constructed to analyze and optimize the performance of stocks and flows as illustrated in Exhibit 2. These performance curves provide practical analytics that enable managers to establish and manage the most profitable combination of buffers for their business’ expected levels of variability in demand and supply.
Exhibit 2: Performance Curves
A standard model describing the behavior of all operations is as follows.
- In a perfect world, demand and transformation are perfectly synchronized—no variability.
- In the real world, there is variability. This means the perfect world is an impossible performance goal.
- When trying to synchronize demand and transformation in the presence of variability, buffers will appear. Buffers act as a clutch or a shock absorber for variability. Buffers are not optional.
- The three buffers are inventory, capacity and time. Inventory and time are mirror images of each other. Inventory occurs when products are completed early. Back orders occur when products are completed late so customers wait; the same happens when a customer orders a make-to-order product. So, technically there are only two buffers: capacity and net inventory. Net inventory equals on-hand inventory minus backorders. In practice, managers deal with inventory and late orders differently, so it’s most useful to talk about three buffers instead of two.
Finding Your Way in the Maze of Operations Management
The science is practical and powerful. At Baxter Healthcare, one of its plants had installed a one-piece flow line but over 15 years had failed to meet the expected design output. A simple operations science analysis directly to a 30% increase in throughput. While not an orthopaedic-specific example, a walkthrough of the steps taken provide insight into how the operations science approach works.
Baxter had started from the one-piece flow approach. Its plant produced blood filtration kits, a fairly simple assembly of plastic tubes, bags and filters. The line was highly automated and is depicted in Exhibit 3.
Exhibit 3: Baxter Healthcare Line
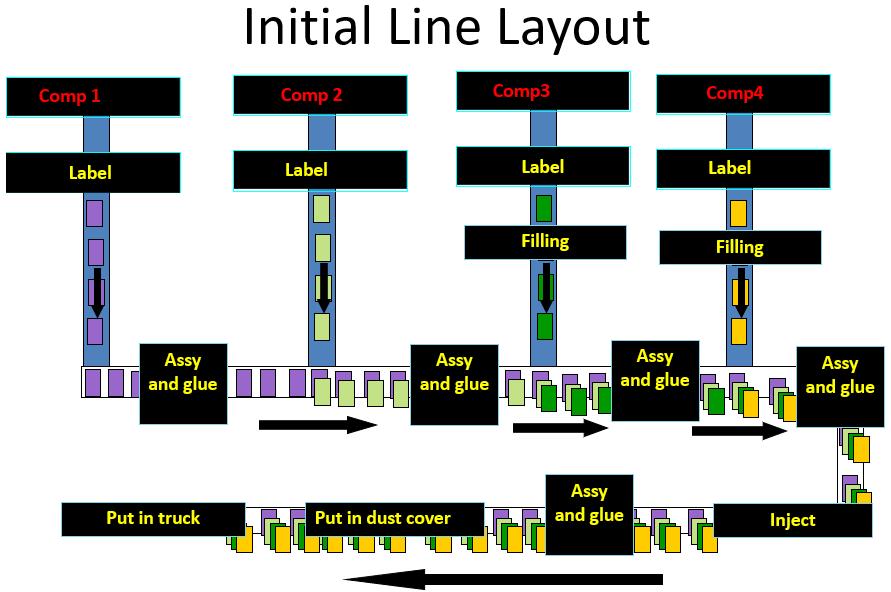
Components were introduced to the line, assembled and glued together to get to the final assembly which was then bagged, the bag injected with an inert gas, packaged and shipped. It was a complex operation, but we used a simple operations science analysis called Quick Flow Benchmarking to do an initial analysis. Quick Flow Benchmarking only requires four pieces of data and can be done in about one hour. Data required is:
- Bottleneck Rate
- Raw Process Time (the quickest time a product can be completed on the line, including downtime, setup and batching effects)
- Current Throughput
- Current Work in Progress (WIP)
The result is shown in Exhibit 4 and it provided the key to productivity increases for Baxter.
Exhibit 4: Baxter Healthcare Analysis

The analysis showed that they needed more WIP in the line, not less—a counter-intuitive conclusion for those with the one-piece flow mindset. The thinking is that WIP is waste, so less WIP is better. What that understanding ignores is that unused capacity is waste, usually much more expensive waste. Wasted capacity is not as visible as WIP. Therefore, the wasted capacity is often ignored.
Operations science illuminated a trail of clues that the site management had missed. The sequence was as follows.
- Baxter needed to get as much throughput out of the line as possible. The line was designed for a capacity of 30,000 pcs/day; it had been averaging 22,000 pcs/day.
- For 15 years, Baxter had made minimal improvements to improve reliability and throughput. Its latest effort was to decrease glue time from four seconds to two seconds.
- One day after operations science analytics were performed on the line, the conclusion was that there was not enough WIP in the line.
- Further analysis showed that all parts of the line were hard-coupled. If one feeder line went down, the entire line stopped. All parts of the line would have to run perfectly all the time to achieve target throughput. This meant the availability of the line was product of the availabilities of each component.
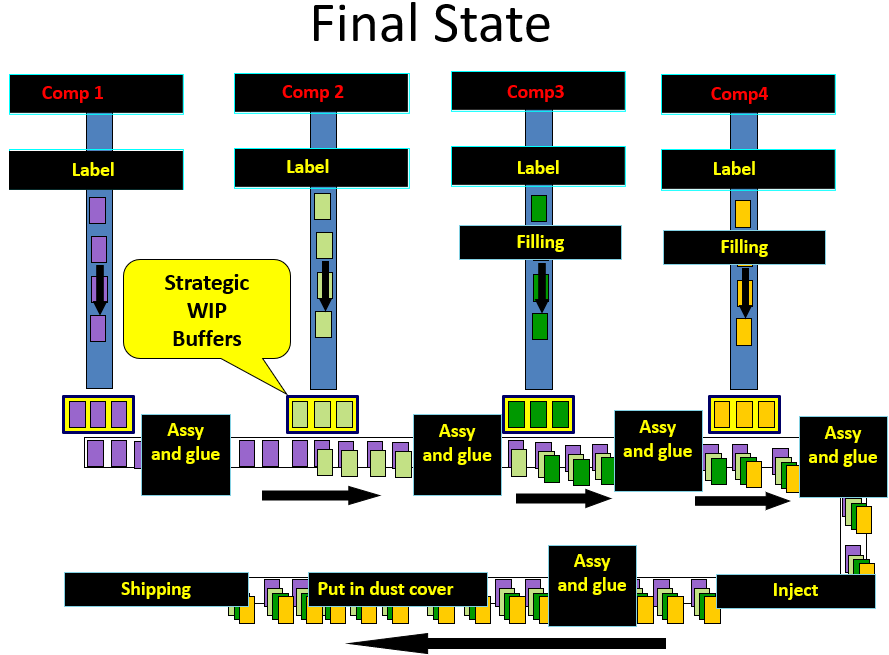
- The solution, illustrated in Exhibit 5, was to decouple the feeder lines from the main line and install strategic WIP buffers between the feeder lines and the main line as shown below. The final result was a 30% increase in throughput. Yes, increasing WIP increased cycle time, but the increase was from about 18 minutes to about 90 minutes and Baxter only shipped once a day. If the WIP had been gold and the increase in cycle time was from one month to five months, they may have made a different decision about the solution.
Exhibit 5: Baxter Healthcare Solution
As a manager, you should arm yourself with powerful knowledge that forces you to ask the right questions and look at the whole problem. It will save you much wasted effort wandering in an operations management knowledge maze and provide you a reputation of credibility as you advance in your career.
- http://www.industryweek.com/companies-amp-executives/everybodys-jumping-lean-bandwagon-many-are-being-taken-ride
- Chakravorty, S., “Where Process Improvement Efforts Go Wrong,” Wall Street Journal, June 14, 2012.
- Flyvbjerg, Bent ,”Megaprojects: Over Budget, Over Time, Over and Over,” January/February 2017, CATO Policy Report, https://www.cato.org/policy-report/januaryfebruary-2017/megaprojects-over-budget-over-time-over-over
- Hopp and Spearman, 2008, “Factory Physics,” 3rd Edition, Waveland Publishing, Long Grove, Illinois
Edward S. Pound, an OMTEC® 2018 speaker, is Chief Operations Officer at Factory Physics Inc. and lead author of McGraw-Hill’s lead business title, Factory Physics for Managers. He has more than 25 years of management and consulting experience in medical devices, aerospace, electronics, pharmaceuticals, cloud infrastructure development, consumer retail, healthcare, energy and public infrastructure construction, and engineer-to-order capital equipment. Mr. Pound has helped pioneer the advanced benefits that the practical science of Factory Physics principles brings to business. He holds a B.S. and a M.S. in mechanical engineering, a M.E.M and a M.B.A. He is also a Past President of the Industrial and Systems Engineering Society’s Work Systems division and serves on its Board of Directors.